50 Years of Air, Water and Wild Life Quality Improvements


I moved to the United States in 1976. It was an interesting time because the United States had recently enacted laws that were intended to improve the country’s air, water, and wild life.
Instead of specific archaic environmental laws that, for example, outlawed dumping dead horses into the Hudson River, these were nationwide laws that set a minimum national standard that was to be enforced by the newly created EPA.
These laws were enacted during the Nixon administration even though some of these laws were vetoed by Nixon and had to be overridden by a congressional super majority.
I suppose these laws were passed by Congress because it was patently clear to both Democrats and Republicans that things were not the way they were supposed to be. Many animal species had disappeared, rivers were burning and air pollution was so bad it was literally killing people. I am not fully familiar with the debates during the creation of those laws, but I am sure there were factions that were predicting total economic collapse if those laws were enacted and, in general, there was strong corporate resistance based on the fear profits would decrease when corporation were forced to reduce pollution and clean up the mess they had made in the past.
I am almost certain that these laws negatively affected profits of corporations that had caused the damage to the environment, but I very much doubt that the overall economy was negatively affected by these laws, because the reduced profits actually paid for new industries that were involved in reducing and remedying pollution. Those businesses did not really exist prior to the environmental laws and now were providing good incomes for a significant part of the population. It should be remembered that the quality of an economy is most strongly related to employment and it makes no difference if that employment is related to creating pollution or cleaning up pollution.
Most of all, there is no reason to feel sorry for any person or business that made a mess of things the moment they are required to clean up the mess they made.
What is often ignored in the environmental debates is that the lowest hanging fruit is a drive to greater technological efficiencies, which reduces costs for everybody. And once things start to improve, everybody’s health and quality of life is improved with a cleaner environment. When those trends are combined it becomes clear environmental protection and pollution remediation is a killer app. It does not happen overnight, but, looking back over the past 50 years, the results are nothing but astonishing. Everybody truly lives better today than 50 years ago. Not just the rich; everybody has a higher quality of life. Even in underserved communities where a lot remains to be done, the results are still positive.
Quantifying the results is difficult, but the results are all around us. Our rivers and our coast, overall, are much cleaner. There have been marked improvements in species recovery (even though, unfortunately, it can also be described as a significantly reduced rate of extinction). While we are challenged with achieving zero carbon, overall, our air quality is much better.
I have not been able to to find a quantitative analysis of water quality, since it is difficult to cast all the minor and major local improvement into a single nationwide whole. One exception to this is OPA 90 and its IMO derivatives. There the result is nothing short of astonishing, but it is only a small part of overall water quality management. The one thing that can be measured and quantified is national air quality and the EPA provides an annual report on it called “EPA Air Quality – National Survey”.
These annual reports come with a graphic that is called the Baby Graphic and it is copied for this article.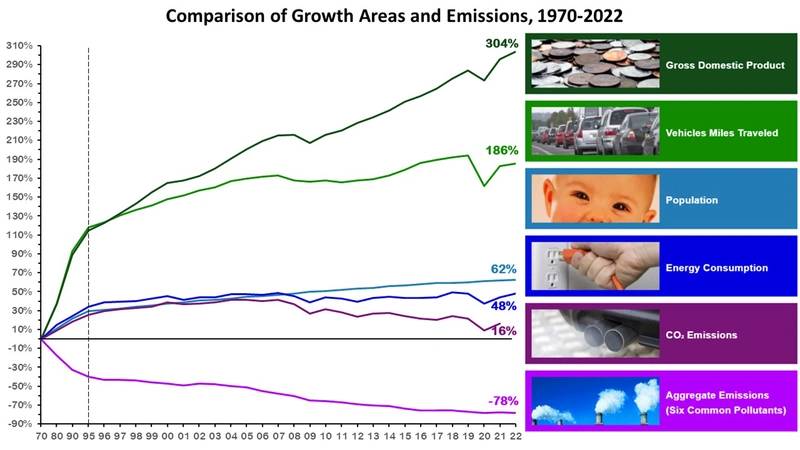 Chart courtesy Rik van Hemmen
It is a great graphic but first I need to point out that it contains an annoying distortion. At first glance it may appear that there were much more dramatic changes from 1970 to 1995, but that is related to the compressed X axis scale for that period. After 1995, changes are recorded year by year, while before 1995 the same interval covers five years. For better perspective I properly expanded the scale, and drew in straight lines for the 1970 to 1995 interval. It then shows all overall trends are pretty steady until 2008 except GDP growth, which appears to have increased in the more recent 27 years.
 Chart courtesy Rik van Hemmen
2008 is where things become interesting. At that point the trends start to change. Keep in mind we are looking at 2008, the year of the Great Crash. That was a dramatic historical moment of great economic upheaval, but, from an environmental point of view, things changed for the better. This is the point in time when the population continues to grow at a very steady pace. (Yes, the present immigration concerns are not a population growth issue.), but the GDP grows much faster, so we are all getting richer. At the same time, energy consumption goes flat and CO2 emissions starts to drop. In effect, since 2008 the trends are going where we want them to go. There was a drop during COVID, but, overall, the trends are steady.
There is a subtle flattening of the air improvement curve, but that is probably a temporary effect due to technical limits with regard to fossil fuel combustion. Once we electrify everything there will be a second wave of air quality improvements.At this stage it is unclear if energy consumption will continue to decrease against GDP, but as long as we continue to phase out fossil fuels that is not an immediate concern. (It may an issue once fossil fuels have been phased out, because too much cheap energy turns us all into inefficient energy hogs)
The really fun part of this graph is that it actually gives us a glimpse into the future. If we continue to convert to zero carbon, there will be less air pollution and there will be less carbon, a win win at no cost to the economy in general. And the faster we do it, the more everybody benefits.
The day after I wrote the first draft of this column, I came across a new DNV report named “Energy Transition Outlook, New Power Systems” that supports these trends and, in addition, notes that the cost of energy per capita will actually go down once fossil fuels have been phased out. This is a big deal, since the cost of energy per capita is one of the most significant indicators of general wealth.
It is so easy to think the world is going to pot, but compared to the 1970’s the important trends have never been this good! Nobody said it would be easy, but there is a bright light shining at the end of the tunnel.
For each column I write, MREN has agreed to make a small donation to an organization of my choice. For this column I nominate New Jersey Friends of Clearwater. A small group of peaceful environmental warriors that remembers how bad it was in 1970.
References:
https://www.epa.gov/air-trends/air-quality-national-summary
https://brandcentral.dnv.com/original/gallery/10651/files/original/f5149884-79ab-4a3e-99f2-10e59e36db79.pdf