Matson Announces Q2 2019 Results; Lowers FY2019 Outlook
Matson reported net income of $18.4 million, or $0.43 per diluted share, for the quarter ended June 30, 2019. Net income for the quarter ended June 30, 2018 was $32.6 million, or $0.76 per diluted share. Consolidated revenue for the second quarter 2019 was $557.9 million compared with $557.1 million for the second quarter 2018.
For the six months ended June 30, 2019, Matson reported net income of $30.9 million, or $0.72 per diluted share compared with $46.8 million, or $1.09 per diluted share in 2018. Consolidated revenue for the six month period ended June 30, 2019 was $1,090.3 million, compared with $1,068.5 million in 2018.
Matt Cox, Matson's Chairman and Chief Executive Officer, commented, "Our performance in the second quarter was mixed, with Ocean Transportation operating income coming in below expectations and Logistics posting stronger-than-expected operating income. Within Ocean Transportation, we performed as expected across most of our tradelanes, except we saw a weaker-than-expected Hawaii market, and we were negatively impacted by a lower contribution from SSAT primarily driven by additional expense related to the early adoption of the new lease accounting standard, which we expect to reverse in the second half of this year, and higher terminal operating costs. Within our Logistics segment, we continued to perform well with positive contributions to operating income across all service lines."
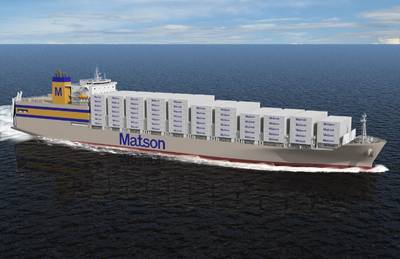
Mr. Cox added, "The Company continues to expect net income in 2019 to decline year-over-year; and we are lowering our outlook for EBITDA in 2019 by approximately $18 million as a result of continued weakness in the Hawaii tradelane and the unexpected higher operating costs at SSAT in the second quarter, the latter of which is largely behind us. Within Logistics, we continue to expect solid performance in the second half of the year and are raising the full year outlook for operating income. We view 2019 as a transition year and remain confident about achieving the approximately $30 million in previously-mentioned annual financial benefits from the new vessels. A portion of these benefits coupled with expected financial benefits on other recent vessel and infrastructure investments should produce approximately $30 million in financial benefits in 2020. In 2021 and thereafter, we expect the full year run-rate of these total investments to produce approximately $40 million of annual financial benefit."
Second Quarter 2019 Discussion and Outlook for 2019
Ocean Transportation: The Company's container volume in the Hawaii service in the second quarter 2019 was 2.3 percent lower year-over-year primarily due to negative container market growth. The GDP of the Hawaii economy continues to grow, albeit at a slowing pace; however, containerized freight market volume has not been keeping pace with GDP growth. The Company expects volume in 2019 to be lower than the level achieved in 2018, reflecting less containerized freight volume in Hawaii and stable market share.
In China, the Company's container volume in the second quarter 2019 was 2.5 percent higher year-over-year. Matson continued to realize a sizeable rate premium in the second quarter 2019 and achieved average freight rates moderately higher than the second quarter 2018. For the second half of 2019, the Company expects volume to be lower than the prior year as volume normalizes to a traditional level of activity relative to the strong level achieved in the second half of 2018 resulting from the U.S.-China trade situation. For the full year 2019, the Company expects average freight rates to approach the levels achieved in 2018.
In Guam, the Company's container volume in the second quarter 2019 was flat on a year-over-year basis. For 2019, the Company expects volume to approximate the level achieved last year and expects the highly competitive environment to remain.
In Alaska, the Company's container volume for the second quarter 2019 was 8.0 percent higher year-over-year, primarily due to the timing of two additional northbound sailings. For 2019, the Company expects volume to be moderately higher than the level achieved in 2018 with higher northbound volume supported by improving economic conditions in Alaska and higher southbound seafood-related volume due to stronger seafood harvest levels than in 2018.
The contribution in the second quarter 2019 from the Company's SSAT joint venture investment was $8.2 million lower than the second quarter 2018 primarily due to additional expense related to the early adoption of the new lease accounting standard in the quarter and higher terminal operating costs. Compared to our previous outlook, we expect approximately $5.8 million in lease-related costs to reverse and be a benefit to SSAT's results in the second half of 2019. For 2019, the Company expects the contribution from SSAT to be lower primarily due to higher terminal operating costs, partially offset by higher lift volume.
As a result of the first half performance and the outlook trends noted above, the Company expects full year 2019 Ocean Transportation operating income to be approximately 20 percent lower than the $131.1 million achieved in 2018 after taking into account a full year net operating expense impact of $7.2 million associated with the sale and leaseback of MV Maunalei. In the third quarter 2019, the Company expects Ocean Transportation operating income to be moderately lower than the level achieved in the third quarter 2018.
Logistics: In the second quarter 2019, operating income for the Company's Logistics segment was $1.8 million higher compared to the operating income achieved in the second quarter 2018 due to higher contributions across all of the service lines. For 2019, the Company is raising its outlook and expects Logistics operating income to be approximately 10-15 percent higher than the level achieved in 2018 of $32.7 million. In the third quarter 2019, the Company expects operating income to approximate the level achieved in the third quarter 2018.
Depreciation and Amortization: For the full year 2019, the Company expects depreciation and amortization expense to be approximately $133 million, inclusive of dry-docking amortization of approximately $38 million. As a result of the previously announced scrubber program on six vessels, dry-dock amortization was accelerated on two vessels in the second quarter, which increased depreciation and amortization in the quarter by $1.4 million and is expected to increase depreciation and amortization for the full year 2019 by approximately $4.2 million.
EBITDA: The Company expects net income in 2019 to decline year-over-year and expects EBITDA in 2019 to be approximately $270 million.
Other Income (Expense): The Company expects full year 2019 other income (expense) to be approximately $2.7 million in income, which is attributable to other component costs related to the Company's pension and post-retirement plans.
Interest Expense: The Company expects interest expense for the full year 2019 to be approximately $25 million.
Income Taxes: In the second quarter 2019, the Company's effective tax rate was 28.4 percent. For the full year 2019, the Company expects its effective tax rate to be approximately 26.0 percent, which excludes a positive non-cash adjustment of $2.9 million in the first quarter of 2019 related to the reversal of an expense adjustment in 2018 arising from the enactment of the Tax Cuts and Jobs Act of 2017.
Capital and Vessel Dry-docking Expenditures: For the second quarter 2019, the Company made other capital expenditure payments of $24.9 million, capitalized vessel construction expenditures of $9.7 million, and dry-docking payments of $3.7 million. For the full year 2019, the Company expects to make other capital expenditure payments, including maintenance capital expenditures, of approximately $100 million, vessel construction expenditures (including capitalized interest and owner's items) of approximately $215 million, and dry-docking payments of approximately $20 million.
Results By Segment
Ocean Transportation — Three months ended June 30, 2019 compared with 2018
Ocean Transportation revenue increased $8.8 million, or 2.2 percent, during the three months ended June 30, 2019, compared with the three months ended June 30, 2018. The increase was primarily due to higher freight revenue in Alaska, higher fuel surcharge revenue and higher average rates in China, partially offset by lower container volume in Hawaii.
On a year-over-year FEU basis, Hawaii container volume decreased 2.3 percent primarily due to negative container market growth; Alaska volume increased by 8.0 percent primarily due to the timing of two additional northbound sailings; China volume was 2.5 percent higher; Guam volume was flat; and Other container volume increased 29.7 percent primarily due to the South Pacific and Okinawa services.
Ocean Transportation operating income decreased $16.8 million, or 46.0 percent, during the three months ended June 30, 2019, compared with the three months ended June 30, 2018. The decrease was primarily due to higher vessel operating costs (including MV Maunalei lease expense), a lower contribution from SSAT, higher terminal handling costs and lower volume in Hawaii, partially offset by a higher contribution from the Alaska service and higher average rates in China.
The Company's SSAT terminal joint venture investment contributed $0.9 million during the three months ended June 30, 2019, compared to a contribution of $9.1 million during the three months ended June 30, 2018. The decrease was primarily due to additional expense related to the early adoption of the new lease accounting standard in the quarter and higher terminal operating costs.
Logistics — Three months ended June 30, 2019 compared with 2018
Logistics revenue decreased $5.6 million, or 2.0 percent, during the six months ended June 30, 2019, compared with the six months ended June 30, 2018. The decrease was primarily due to lower transportation brokerage revenue, partially offset by higher freight forwarding revenue.
Logistics operating income increased $5.7 million, or 41.6 percent, for the six months ended June 30, 2019, compared with the six months ended June 30, 2018. The increase was due primarily to higher contributions from transportation brokerage and freight forwarding.
Liquidity, Cash Flows and Capital Allocation
Matson's Cash and Cash Equivalents increased by $4.4 million from $19.6 million at December 31, 2018 to $24.0 million at June 30, 2019. Matson generated net cash from operating activities of $108.2 million during the six months ended June 30, 2019, compared to $119.1 million during the six months ended June 30, 2018. Capital expenditures, including capitalized vessel construction expenditures, totaled $69.0 million for the six months ended June 30, 2019, compared with $192.3 million for the six months ended June 30, 2018. Total debt decreased by $11.8 million during the six months to $844.6 million as of June 30, 2019, of which $791.0 million was classified as long-term debt.
Matson's Net Income and EBITDA were $93.1 million and $270.1 million, respectively, for the twelve months ended June 30, 2019. The ratio of Matson's Net Debt to last twelve months EBITDA was 3.0 as of June 30, 2019.
As previously announced, Matson's Board of Directors declared a cash dividend of $0.22 per share payable on September 5, 2019 to all shareholders of record as of the close of business on August 1, 2019.


