Royston upgraded its enginei fuel management system with the addition of a new emissions monitoring capability.
Building on the enhanced fuel data analysis and engine performance reporting options provided by the enginei technology, the latest version of the system incorporates a special engine profile-based emissions analysis feature.
Operating without the need for an exhaust gas analyzer, the new system developed by Royston captures key engine performance data, engine and fuel specifications, and flow rates which are then used for the accurate calculation of a range of vessel emissions measurements.
NOx profiles for individual engines are created using the ‘carbon balance method’ which refers to the NOx Technical Code MEPC 177 (58), statistical algorithms and engine test data. Combining this with operational factors such as torque, RPM and other engine and fuel data enables a specific NOx emissions factor to be calculated for comparison with IMO regulations.
In addition, SOx and CO2 emissions are computed from the mass balance conversion factor applied to the adjusted fuel consumption and air mass flow, alongside combustion efficiency. This enables advisory SOx levels to be predicted, informing fuel switch over decisions during travel in emissions controlled zones.
In addition to the automatically generated emissions measurements, the upgraded enginei system also provides important combustion efficiency data, assessing engine power against both fuel consumption and engine speed.
Comparisons of individual engine performance based on specific fuel oil consumption measurements are also made as part of essential fuel analysis and optimisation decisions.
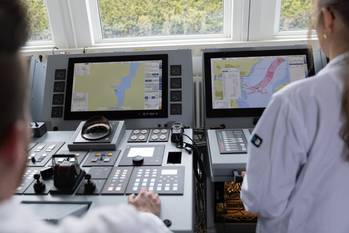
All fuel and emissions data collected by the enginei system can be automatically incorporated into daily reports in a range of formats. On board the vessel, touchscreen monitors on the bridge and in the engine control room show all aspects of key vessel performance criteria using simple dial displays and gauges or more complex presentations of trending graphs against voyage data.
The information captured on board is also made available for remote interrogation by onshore management and supervisory staff through a secure online portal and web dashboard, with computer generated charts, graphs and Google mapping to show the complete operational profile of a vessel.


 Read the Magazine

 Read the Magazine
