Eye on Design: Where Are the Transportation Macro Designers?
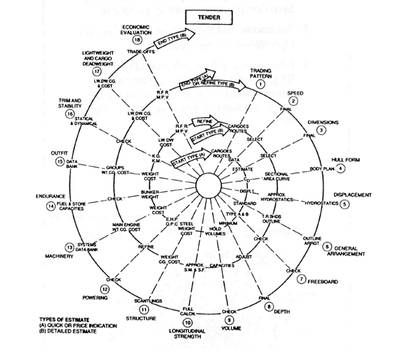
As naval architects and marine engineers we are familiar with the design spiral. While design is not truly a spiral, we use the concept to remind ourselves that all pieces of a ship design interact. The design spiral is not a standard figure and can be simplistic or overcomplicated.
A Google search image summary provides dozens of interpretations, all investigating different variables, with the only commonality that all spirals start with the “mission” variable.
Figure 1 is an old and pretty one that is still being referred to today.
It is important to stress that real design does not really work like the spiral indicates, it is both messier and more elegant, and relies heavily on the experience of the designer. Some very clever design theorists have provided alternative approaches, but as a design philosophy tool, the design spiral retains its core validity.
A beginning designer pretty much has to start at step one and go through every step, but experienced designers for a particular ship type can often jump in somewhere along the middle of the spiral and pull the whole thing off in two trips along the disk.
Really good designers, who have made many design spiral trips, can draw a near complete design on the back of an envelope and never need to refer to the spiral. (The concept for the LST was sketched out by John Niedermair on a scrap of paper and was incredibly close to its final design.)
The design spiral is actually a warning; if you skip a step, you will likely get into trouble. Design is a system of checking boxes (the Sectors) and refinement (the Spiral) and the Design Spiral explains it graphically. Often a more concise list of steps will suffice and Figure 2 is a simpler list of steps.
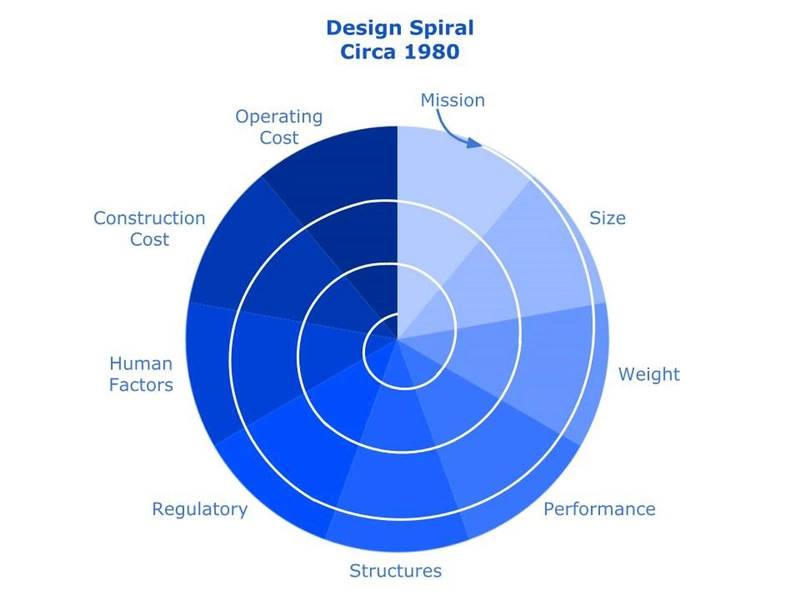 Figure 2: Design Spiral 1 Circa 1980.
In this spiral, which I will call Design Spiral 1, the first step is on the outer rim and the final design is the point in the middle of the disk. While one can choose an almost limitless number of design considerations (sectors, variables), for the sake of this discussion I have provided the following design sectors: Mission, Size, Weight, Performance, Structures, Regulatory, Human Factors, Construction Cost and Operating Cost. I made it modern and included Human Factors, which is a very important consideration and was omitted in the spiral in Figure 1.
About 25 years ago I first suggested that the design spiral needed an update. Besides the common spiral sectors such as those shown in Spiral 1, I proposed that designers need to include environmental and sustainability concerns into their trip around the design spiral.
It was simply an attempt to draw attention to a changing world, and while I think my suggestion had little effect by itself (I could not “Google” a design spiral that shows these categories), it may have been a tiny cog in a large gear that has slowly turned and, today, designers do take the environment and sustainability into account in their designs. At least, at a minimum, as a regulatory requirement (EEDI). Although complying with regulations rarely means you have achieved an optimal design.
This would have changed the design spiral complexity to Spiral 2 in Figure 3.
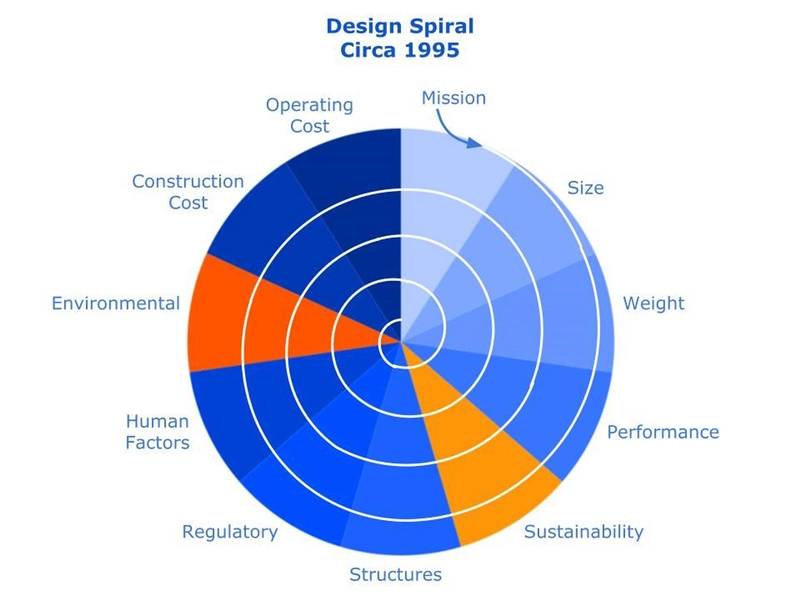 Figure 3: Design Spiral 2 Circa 1995
These additional considerations have increased the complexity of the design of ships and probably have modestly increased the sustainability of shipping and reduced the environmental impact of ships. It is significant to note that with increasing sectors, increasing trips around the sectors are required to arrive at an optimized solution and therefore there are now more coils in the spiral.
Only when writing this did I realize that the design spiral has once again increased in complexity since it does not include a power source sector, which determines the level of hybridization of the power source for the ship. This is the sector where the designer does not just pick the propulsor (which would be considered under the Performance sector) but also the combination of power sources that result in the most efficient design for its mission.
Therefore, while in recent years past, the design spiral looked like Figure 3, today, it looks more like Figure 4.
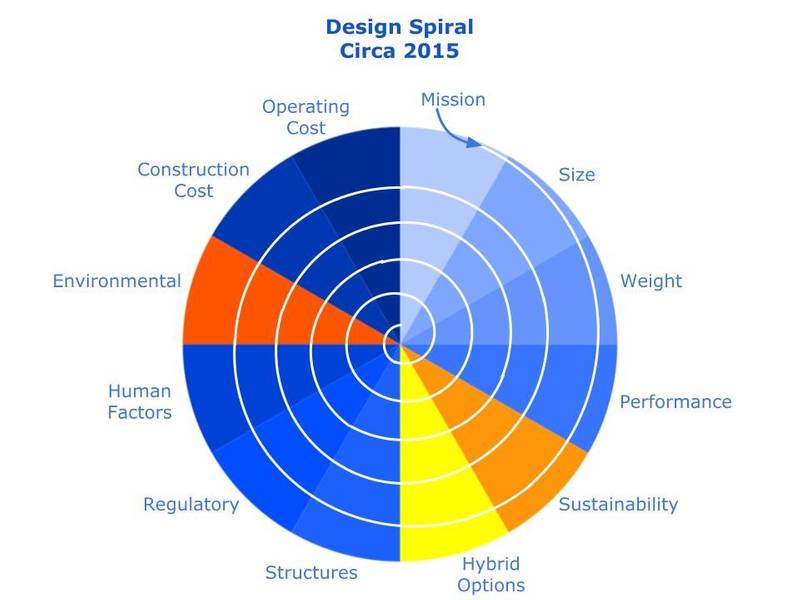 Figure 4: Design Spiral 3 Circa 2015
However, frustratingly, ship designers only focus on specific ships for specific missions. That focus then results in efficient ships for their intended trade, but it does not provide the most efficient transportation for our world.
Efficient individual components do not necessarily result in efficient systems. Even stranger, inefficient components may very well result in very efficient larger systems. ISO shipping containers simply copied the dimensions of road cargo trailers and nobody has ever checked if this is an efficient size, but there is no doubt the use of ISO containers has done an incredible job of increasing worldwide cargo shipping system efficiencies.
But getting back to the inefficiency of efficient components, it is possible to design a very efficient ship, but the use of that ship can very well result in less-than-optimal transportation of the goods it is intended to transport. This is an incredibly complex issue, but if not properly analyzed and designed will result in unnecessary waste and CO2 emissions on a global level.
The question is: How do we analyze that? Is there an equivalent design diagram that we can use as a mental aid?
While the design spiral can apply to all types of ships, in cargo shipping, the mission is generally defined as the ability to deliver a certain amount of cargo between two ports, but CO2 is not defined by port-to-port emissions; it is defined by door-to-door emissions.
Such a design diagram would need to straddle a new mission outlook; instead of port-to-port, we need to analyze door-to-door. I suppose we would call that full system mission, and that would add another sector beyond hybrid options and we would end up with something like Figure 5.
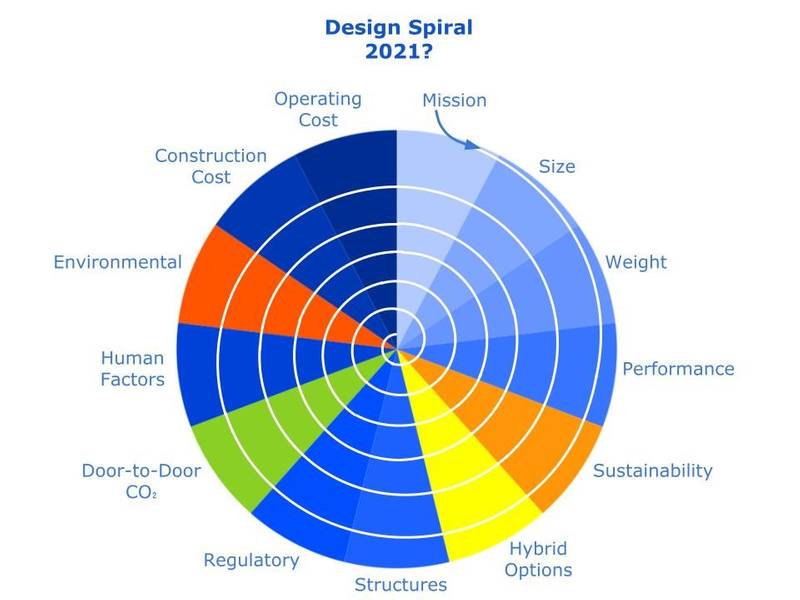 Figure 5: Design Spiral 4, the CO2 reality
Very complex with many more trips around the sectors. And then the central question is this: Who are the people that would exercise this spiral to come up with viable solutions? Transportation engineers? Systems engineers? Naval Architects? Macro economists?
Or maybe a combination of them (although designers know that design by committee always results in camels). Computer engineers may look at this and think in terms of databases, computations, and optimization program loops, but, while helpful in refinement, the inspiration and direction will need to come from designers that have entered the twilight zone spiral for many years. This type of design may very well be the last place where AI will take over, if at all.
Do these professionals actually exist? We need this type of analysis, but who is doing it?
These professionals would be the transportation macro designers. I have looked far and wide, but, so far, have never seen an engineer specialize at that level. And without the benefit of those elusive engineers, we are bound to come up with the wrong solution time after time. Not a pleasant prospect.
For each column I write, MREN has agreed to make a small donation to an organization of my choice. For this column I nominate the Center for Post Carbon Logistics. www.postcarbonlogistics.org They are not quite doing the macro economics thing, but at least are knocking on its door.
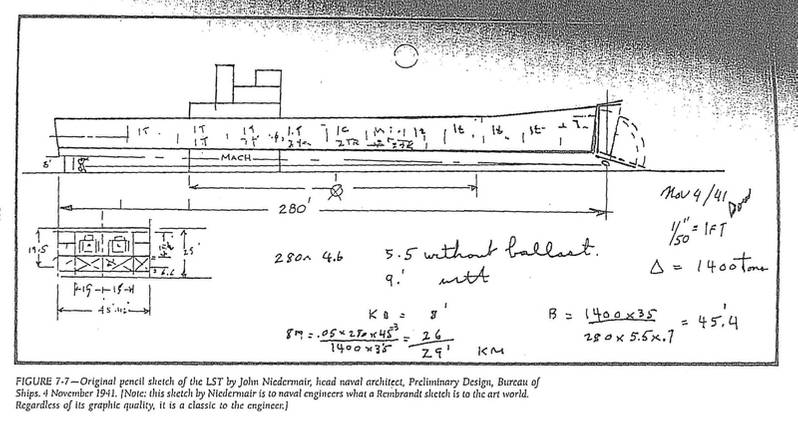 Figure 6: John Niedermair’s initial pencil sketch of the LST. His first pass around the spiral, and very nearly the last pass too. Brilliant. Source: SNAME


