US-China Trade War Shifts Asia’s Manufacturing Landscape -BIMCO
The peak season for containerized exports from Asia to the U.S. is now underway with the COVID-19 pandemic and astoundingly high freight rates making it easy to forget the trade war which has now entered its third year. However, despite the disruption this year, the effects of the tariffs remain clear and the long-term shifts that were already occurring before the pandemic are unlikely to be reversed.
One of the most obvious impacts is the shift in the Asian manufacturing landscape. Manufacturing of many goods now facing tariffs when imported by the U.S.. from China, has moved out of China for manufacturing in neighboring countries. One of the most obvious examples is U.S. imports of Christmas tree lights which has seen Cambodia take over a large part of China’s market share. Another example is U.S. imports of bicycles.
“As the tariffs have provoked a shift in manufacturing within Asia rather than a return of production to the US, volumes being shipped out of Asia remained quite stable before the pandemic hit. The biggest change was in intra-Asian volumes,” says Peter Sand, BIMCO’s Chief Shipping Analyst.
“The shock of the pandemic has caused temporary change, but the changes that have occurred in response to the tariffs will stick around through the pandemic,” Sand adds.
This analysis will focus on two commodities: bikes and Christmas tree lights, as well as the overall changes in U.S. imports from China and the rest of Asia.
The production of 775,000 bikes moved out of China
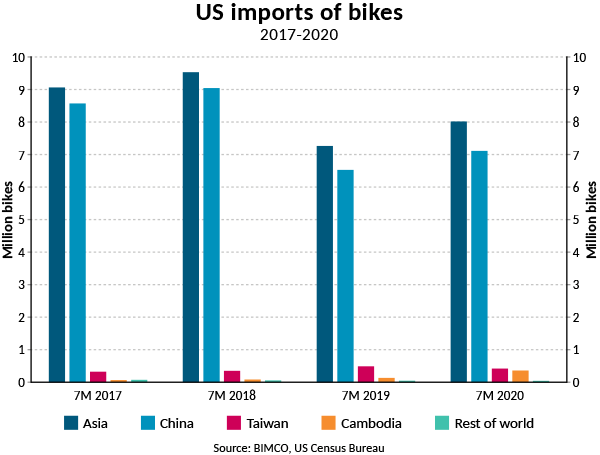
China, and by extension Asia, has for many years been the dominant producer of bikes imported by the U.S. Of the 15.35 million bikes, which the U.S. imported in 2017 (the last year unaffected by the trade war), 15.25 million (99.4%) came from Asia, of which China accounted for 14.37 million (93.7%).
Bikes from China were included in the trade war in July 2018, and although China remains the dominant producer, it has lost some of its share of U.S. exports to Taiwan and Cambodia.

U.S. imports of bikes from China have fallen by 17% in the first seven months of 2020 compared with the same period in 2017, while imports of bikes from the rest of Asia have risen 83.1% though volumes from here remain much lower. In the first seven months of this year, the U.S. imported 7.1 million bikes from China and 0.9m from the rest of Asia. Taiwan and Cambodia’s exports have risen by 30.4% and 478% to 416,169 and 358,718 bikes, respectively.
COVID-19 caps rising dominance in the rest of Asia
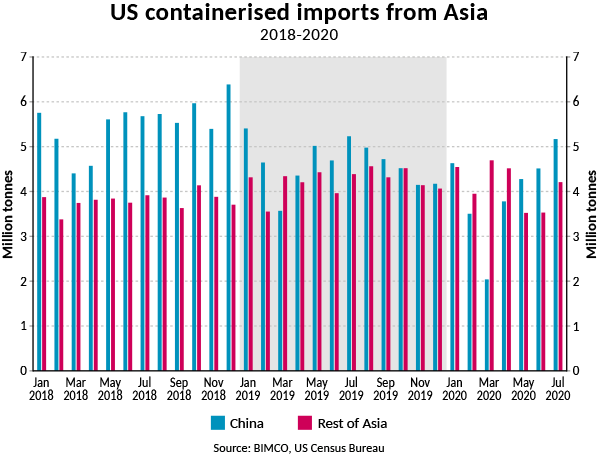
In the first seven months of 2020, U.S. containerized imports from Asia excluding China exceeded imports from China. If this continues in the remaining five months of the year, 2020 will be the first year ever to see this trend.

However, recent months blurs this picture as China has regained the top spot over its neighboring countries. After falling sharply in March, containerized imports from China have recovered and are in July just 61,667 below levels in July 2019. On the other hand, imports from the rest of Asia did not experience the same sudden drop as imports from China but are also taking longer to return to pre-pandemic levels. These different timings of lockdown and pace of reopening means that in Q1, the U.S. imported 3.0m tonnes less (-12.9%) from China than from the rest of Asia, whereas in Q2, China was ahead by 1 million tonnes (+8.6%).
The trend of a narrowing of the gap between China and the rest of Asia really took hold in 2019, when the difference in imports narrowed to 4.7 million tonnes, a marked decrease from the 20.4 million tonnes in 2018. This changing pattern is testament to the shift in manufacturing that has been occurring in Asia for some time. The shift is not only driven by the trade war but also companies looking to move away from China as production costs have increased in comparison with many of its neighbors.
It also demonstrates the lack of proper growth in 2019 compared to 2018 in Chinese exports, one of the main drivers of global trade.
“Importantly for shipping, the U.S. tariffs have not provoked a large-scale return of manufacturing to the U.S., leaving tonne mile demand relatively unaffected. As far as containerized shipping is concerned, whether a good is exported from China or Cambodia makes little difference in terms of distance,” Sand says, adding, “Uncertainty, high when the tariffs were lowered as these new trades were established, but the pandemic has since caused to rocket upwards again.”
Socially distanced, but with plenty of Christmas tree lights
The trend that was observed last year with the Christmas tree lights, which have faced tariffs since September 2018 when imported by the U.S. from China, has continued this year. So far, imports of these goods are following their usual seasonality this year, rising sharply in July.
So far this year, the U.S. has imported 31.5 million sets of Christmas lights, down 3.9% from last year, and compared to the first seven months of 2017, a 13.6% drop. The 13.6% drop has to be seen in the context that imports from China, which in the first seven months of 2017 accounted for 80% of U.S. imports of Christmas tree lights, have fallen by 74.7%, whereas imports from the rest of Asia, and in particularly Cambodia, have risen by 215.3% and 197.8%.
This has caused a 50% rise in imports from Cambodia in the first seven months of the year, from a 14.3% rise in the first seven months of 2017. In contract, China’s share has dropped to 23.3% in the first seven months of this year.
In 2019, U.S. imports of Christmas tree lights totaled 151.9 million sets, down from the record high 190.2 million in 2018, pushed up by frontloading ahead of the tariffs being implemented.


