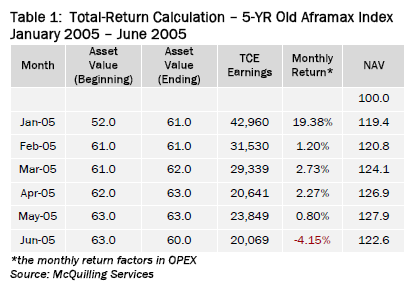
Investors looking for returns in the tanker markets can invest their capital in a variety of ways. Should an owner invest in a VLCC or an Aframax? How about an LR2 or an MR2? What is the historical rate of return for these tankers? Which tanker class is the riskiest? These questions face owners and investors in each investment decision. To compare the different tanker classes on a total-return basis, McQuilling Services has developed a return-on-shipping index that calculates a monthly return by assessing the earnings for a given month (TCE less OPEX) and the gain/loss on the asset value of the specific tanker for that month.
This is analogous to the total return of a stock or fund calculated by the opening and closing price plus any dividends earned in the corresponding period. A total return-on-shipping methodology looks at returns on a continuous basis unlike a project analysis where the return is calculated by a specific set of assumptions tailored to a unique vessel over a defined period. In the case of project analysis, a net present value calculation determines the attractiveness of a project. While both methodologies are useful, a comparison of tankers on a total-return basis using an index-based approach provides a decision maker with a valuable perspective on the long-term viability of an investment.
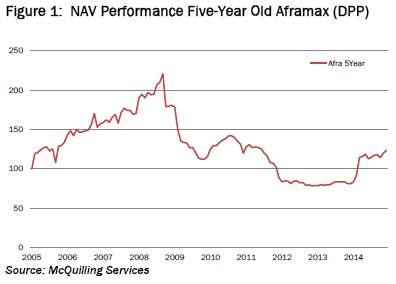
In Table 1, McQuilling Services displayed the calculation used to compute the NAV (net asset value) for the five-year Aframax Tanker Index. Extending the data through December 2014, this index would have hit a high of 220.8 in August, 2008 and a low of 78.5 in October 2012.
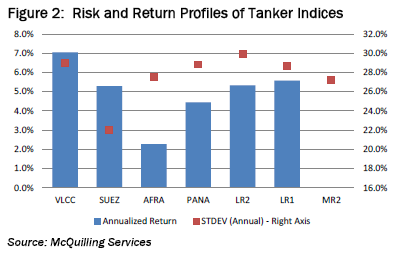
The current NAV for this tanker index is 125.2. Based on today’s NAV, this index would have returned 59.4% from its low point, but would have lost an investor 43.3% if entered into at the high. From inception point (January 2005), McQuilling Services calculate a cumulative return of 25.2% which is annualized to just under 2.3%. The 2.3% annualized return since inception (January 2005) was the second lowest among all the five-year old tankers we evaluated. The worst performing, as measured by an annualized return, was the MR2 tanker which returned just 0.03%, essentially flat. The best performing five-year old tanker index was the VLCC which returned 7.04% in the period.
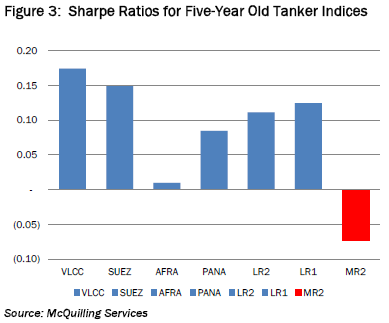
This analysis indicates that the larger tankers on both the dirty and clean side may provide investors with the highest returns over a long-term period. Intuition would also suggest that they would also carry the highest risk profile of the tankers analyzed. However, as we displayed in Figure 2, this is not necessarily the rule. The Suezmax tanker index has returned 5.28% on an annualized basis since inception with a standard deviation of 22.02%, which is well below the variations for the Aframax (approximately 27%). Therefore, in order to identify the tanker index with the best risk-adjusted return, McQuilling Services used the Sharpe Ratio as the measuring stick. The Sharpe Ratio describes how much excess return an investor is receiving for each incremental unit of risk incurred and is calculated by the following formula: Sharpe Ratio = (Return of X – Risk-Free Rate)/Standard Deviation of X with X being the specific tanker index. By using the formula above, we note that the higher the ratio, the more attractive the investment is on a risk-adjusted basis.
In Figure 3, McQuilling Services display the Sharpe Ratios for the five-year old tanker indices we developed and conclude that the bigger tankers may represent better overall investments in general. On the crude tanker side, VLCC and Suezmaxes demonstrated the ability to produce risk-adjusted returns greater than those of the Aframaxes and Panamaxes. On the clean side, LR1 and LR2 tanker indices outperformed the MR2 index confirming the advantage of the larger vessels. The analysis was performed on the 10-year old tanker classes with generally similar results. However, McQuilling Services did observe a more favorable Sharpe Ratio for the Panamax and LR1 tankers as compared to their five-year old counterparts.
McQuilling Services believes its analysis shows that bigger tankers may offer investors a more attractive risk-adjusted return over the long-run. In its upcoming 2015-2019 Tanker Market Outlook, McQuilling Services explores this thesis more deeply by observing rolling return periods to emphasize the impact market timing may have on a tanker investment.


