Senergy Software Pioneers Another Step Change
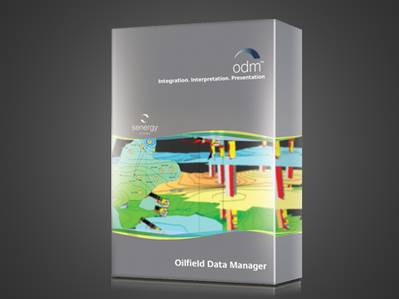
Senergy Software has unveiled major new developments to its market-leading Oilfield Data Manager (ODMTM) software suite, providing geoscientists with significant step changes particularly in the user interface (UI).
The launch of ODM 3.8 includes new Heatmap and Analysis Sticks features as well as pioneering enhancements to its reservoir performance module (RPM) 3D viewer. It also includes a new method for handling core shifts and a powerful new Dictionary Summary.
Senergy’s suite of ODMTM geological tools enables the user to store, integrate, interpret and present all kinds of well-based data. ODM enables the geoscientist to quickly and easily incorporate and visualise numerous forms of data with the objective of using all available information to make an informed interpretation of the subsurface.
John Fraser, VP Products with Senergy, said of the advanced ODM 3.8 development: “ODM 3.8 sees the launch of a significantly-enhanced and updated user interface that improves tool accessibility across the application and makes it easier to navigate, enabling a logical sequence of workflows. “By providing an advanced range of new shortcuts and bringing existing functionality to the surface, the user experience has been considerably enriched and workflows streamlined. This increased flexibility allows the user to dictate display options in charts while improved movement across maps and within data browsers has a tremendous impact on the day-to-day operations performed in ODM.”
Geologist and ODM Product Champion, Catriona Penman, who has been instrumental in taking forward the advancements, said: “ODM 3.8 has incorporated a wide range of user requests to make the day-to-day tasks easier to access, saving us time... and mouse clicks. It doesn’t take long to get used to the new look and feel and the increased flexibility is a valuable addition.”
Other functionality and enhancements introduced in ODM 3.8 are:
- The addition of an RPM extension to the 3D Viewer which makes time-based data viewable in 3D and allows the user to roll time back and forth to examine dynamic behaviour.
- A new method for handling core shifts which can be associated with both discrete and curve data. Once an association has been made, the core shift is automatically applied wherever these data are displayed such as within charts, maps, and crossplots.
- A new chart item, Heatmaps, can be used to display any numeric data, such as discrete sample data or log curve data. They use a colour gradient to represent numerical variation across selected data types for a particular well. Heatmaps are independent items that are added to a chart like a Crossplot or text box.
- A new Dictionary Summary provides a powerful tool for managing dictionaries within ODM. It is a quick method of identifying which dictionaries are associated with a particular data type. It includes individual summaries for graphic and text dictionaries as well as those managed within Stratigraphic Schemes.
- A new import tool for working directly with StrataBugs DEX files accompanies the additional ability to link to Stratabugs 2.0 databases.


