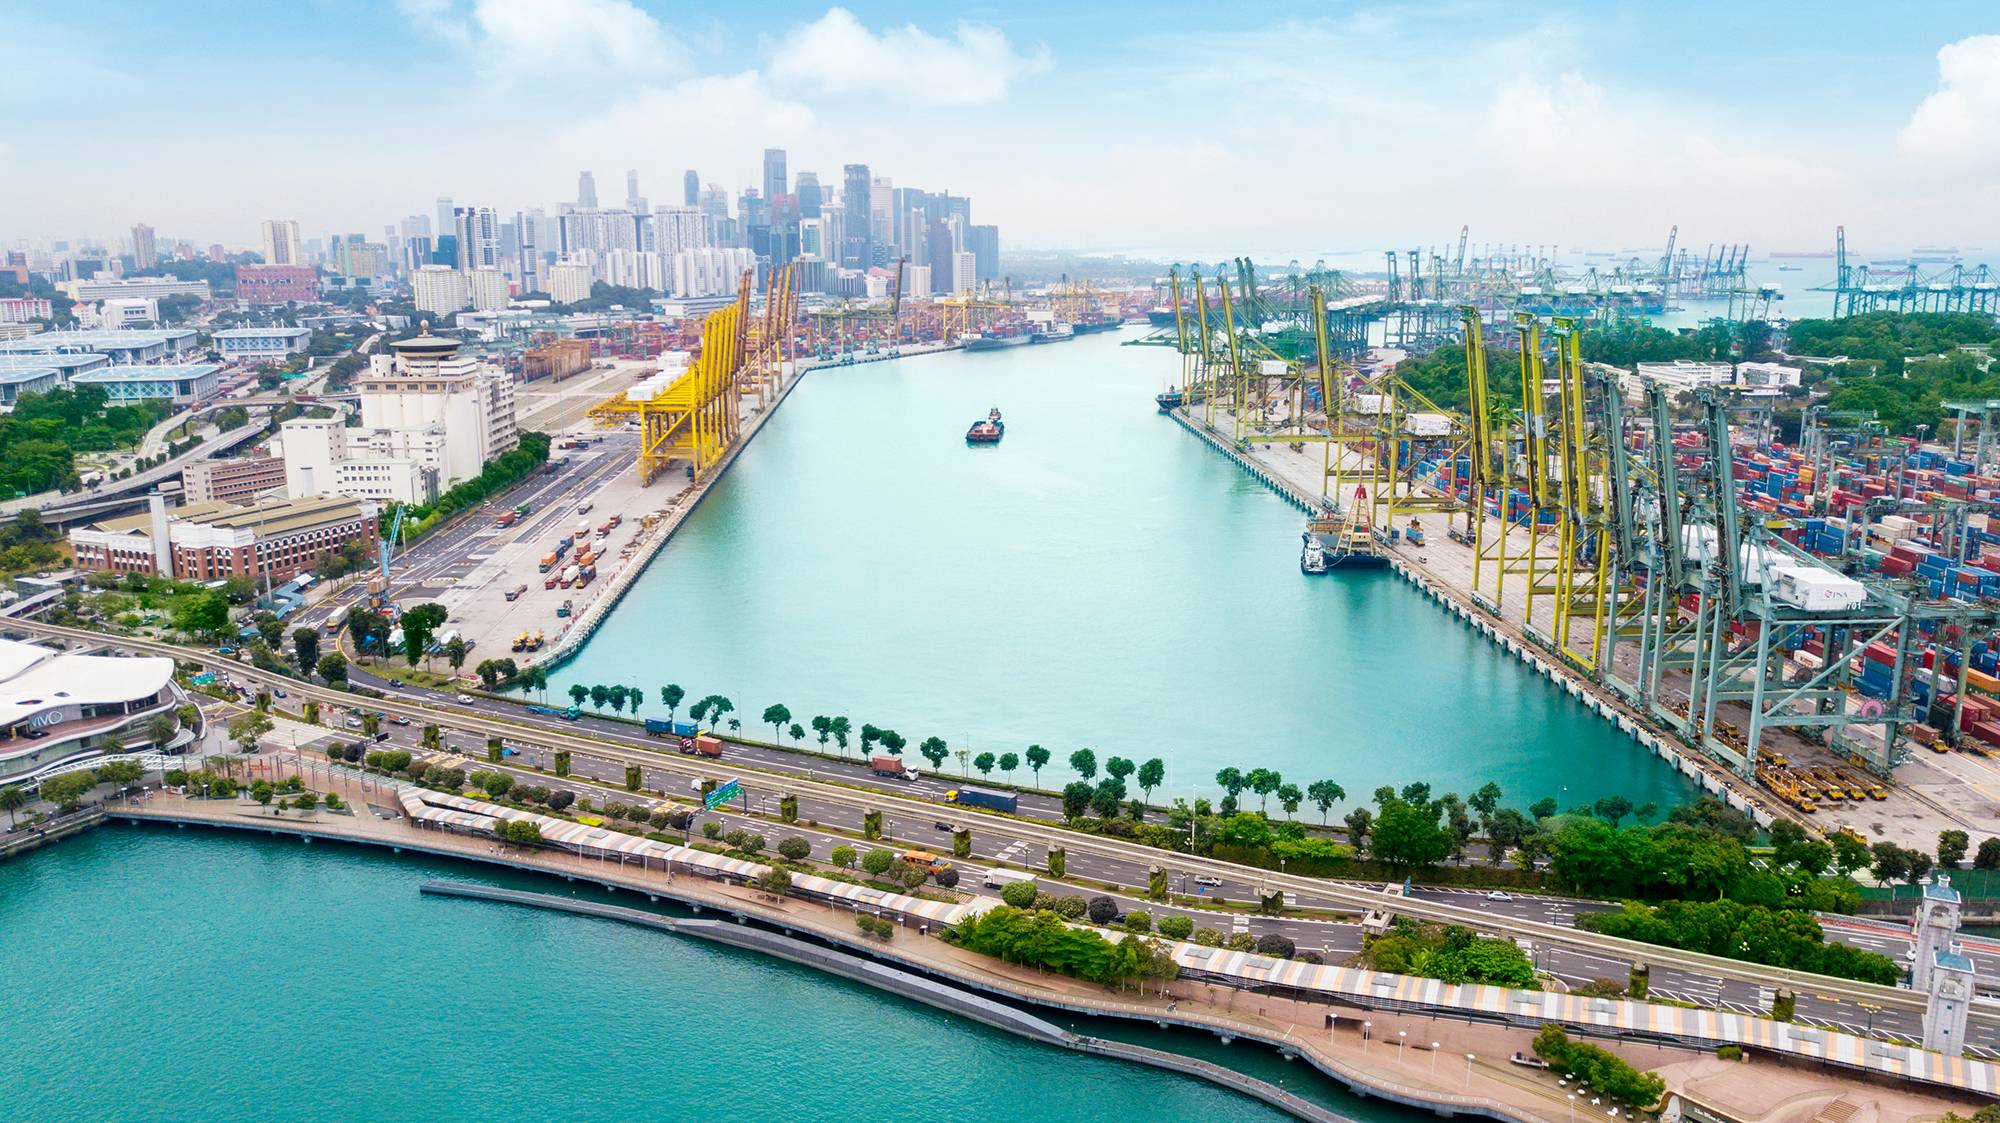
Singapore Marine Fuel Sales Drop

Singapore marine fuel sales fell to their lowest in 20 months in February, official data showed on Friday.
Volumes at the world's top bunker hub totalled 4.15 million metric tons, down 7.1% month on month and sliding 8.1% year on year, data from Maritime and Port Authority of Singapore (MPA) showed.
Weak demand has weighed on the market since the start of the year, dragging premiums down, trade sources said.
Vessel calls for bunkering fell by 14.1% from the prior month to 3,075, hitting two-year lows, data showed.
Sales of the mainstay 0.5% low-sulphur fuel oil (VLSFO) softened sharply in February, totalling 2.07 million tons and hitting multi-year lows.
Singapore delivered-basis bunker premiums for VLSFO logged year-to-date lows, sliding to single digits by late February after holding in low $10s in January, sources said.
High-sulphur marine fuel (MFO) volumes dipped 1.9% at 1.62 million tons, though edging higher year on year.
In contrast, total marine gasoil sales rose 21.2% month on month at 314,600 tons.
Sales of alternative fuels held stable to higher. Marine biofuel volumes rose 2.8% to 110,900 tons, while a delivery for B100 or 100% biofuel was recorded for the first time.
Meanwhile, liquefied natural gas (LNG) bunker sales more than quadrupled to 30,000 tons in February.
Container throughput at Singapore fell by 5.2% to 3.32 million twenty-foot equivalent units (TEUs) in February, their lowest level since last September.
Total | LSFO | Bio-blended LSFO | MFO | Bio-blended MFO | LSMGO | Bio-blended LSMGO | MGO | Bio-blended MGO | MDO | Bio-blended MDO | ULSFO | Bio-blended ULSFO | B100 | LNG | Methanol | Ammonia | |
Jan-24 | 4,906.1 | 2,861.1 | 45.3 | 1,658.8 | 0.0 | 317.0 | 0.0 | 13.5 | 0.0 | 0.0 | 0.0 | 0.0 | 0.0 | 0.0 | 10.4 | 0.0 | 0.0 |
Feb-24 | 4,509.3 | 2,554.6 | 15.6 | 1,601.0 | 0.0 | 296.8 | 0.0 | 14.4 | 0.0 | 0.0 | 0.0 | 0.0 | 0.0 | 0.0 | 26.9 | 0.0 | 0.0 |
Mar-24 | 4,445.1 | 2,419.9 | 66.0 | 1,605.4 | 0.0 | 310.0 | 0.0 | 5.1 | 0.0 | 0.0 | 0.0 | 0.0 | 0.0 | 0.0 | 38.6 | 0.0 | 0.0 |
Apr-24 | 4,235.2 | 2,252.4 | 59.6 | 1,600.5 | 0.0 | 277.4 | 0.0 | 9.7 | 0.0 | 0.0 | 0.0 | 0.0 | 0.0 | 0.0 | 35.6 | 0.0 | 0.0 |
May-24 | 4,826.8 | 2,639.5 | 48.4 | 1,737.8 | 5.3 | 331.0 | 0.0 | 14.3 | 0.0 | 0.0 | 0.3 | 0.0 | 0.0 | 0.0 | 48.8 | 1.6 | 0.0 |
Jun-24 | 4,274.9 | 2,331.1 | 45.3 | 1,557.6 | 2.5 | 278.8 | 0.0 | 8.0 | 0.0 | 0.0 | 0.0 | 0.0 | 0.0 | 0.0 | 51.7 | 0.0 | 0.0 |
Jul-24 | 4,668.7 | 2,485.7 | 42.5 | 1,780.7 | 6.1 | 308.8 | 0.0 | 1.8 | 0.0 | 1.0 | 0.0 | 0.0 | 0.0 | 0.0 | 43.2 | 0.0 | 0.0 |
Aug-24 | 4,559.5 | 2,444.4 | 55.2 | 1,694.8 | 11.2 | 300.4 | 0.7 | 6.4 | 0.7 | 2.0 | 0.0 | 0.0 | 0.0 | 0.0 | 45.6 | 0.0 | 0.0 |
Sep-24 | 4,384.8 | 2,248.0 | 92.4 | 1,640.0 | 16.5 | 334.7 | 0.0 | 11.6 | 0.0 | 3.0 | 0.0 | 0.0 | 1.7 | 0.0 | 36.9 | 0.0 | 0.0 |
Oct-24 | 4,878.6 | 2,514.2 | 116.2 | 1,820.2 | 21.7 | 343.3 | 0.0 | 8.0 | 0.0 | 4.0 | 0.0 | 2.2 | 1.0 | 0.0 | 50.6 | 0.0 | 0.0 |
Nov-24 | 4,463.1 | 2,398.4 | 99.3 | 1,582.6 | 14.0 | 337.8 | 1.3 | 0.5 | 0.0 | 5.0 | 0.0 | 3.0 | 0.9 | 0.0 | 27.5 | 0.0 | 0.0 |
Dec-24 | 4,790.0 | 2,429.6 | 94.1 | 1,875.1 | 12.0 | 327.1 | 0.4 | 3.4 | 0.0 | 6.0 | 0.0 | 0.9 | 0.0 | 0.0 | 48.3 | 0.0 | 0.0 |
Jan-25 | 4,461.7 | 2,431.3 | 92.0 | 1,655.3 | 16.0 | 256.5 | 0.0 | 3.1 | 0.0 | 7.0 | 0.0 | 0.0 | 0.0 | 0.0 | 6.6 | 0.0 | 0.0 |
Feb-25 * | 4,145.1 | 2,065.1 | 85.0 | 1,624.4 | 22.1 | 305.7 | 0.0 | 8.9 | 0.0 | 8.0 | 0.0 | 0.9 | 0.0 | 3.8 | 30.0 | 0.0 | 0.0 |
(Data from Maritime and Port Authority of Singapore)
(Figures are based on latest available data and may be subject to revision at a later date, based on MPA.)
(Reuters)