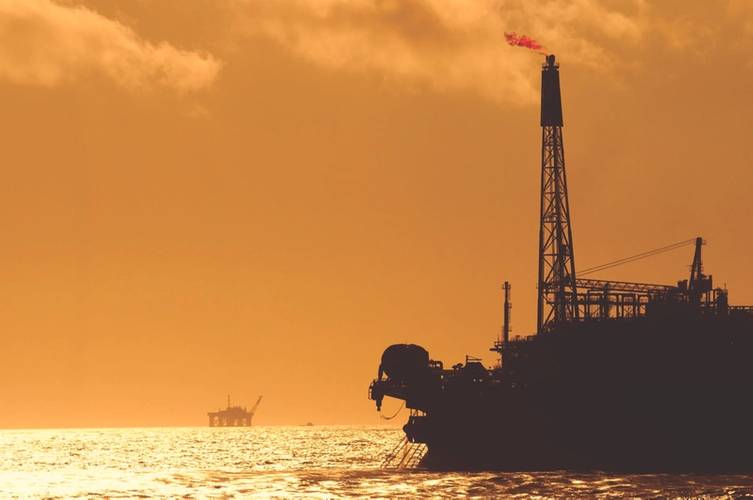
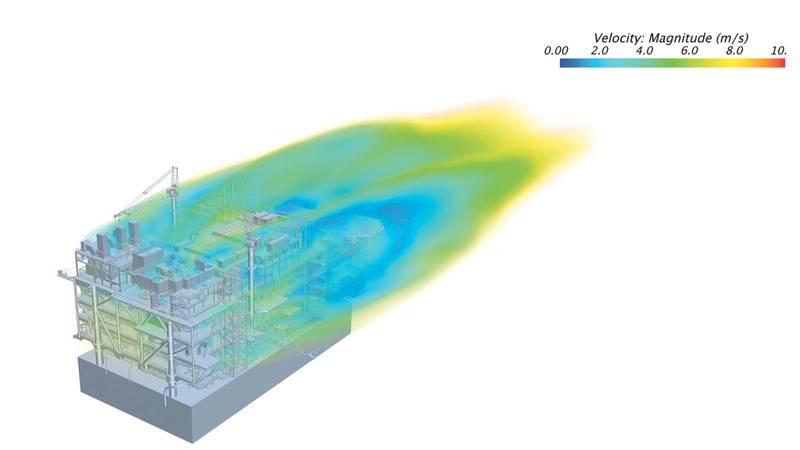
CFD simulations of offshore oil and gas platforms are used to predict the maximum wind loads acting on the structure of the platform topsides (the upper half of the platform, above sea level and outside the splash zone, including the oil production plant, the accommodation block and any drilling equipment). The wind loads are used as waves and current loads to design the mooring of the structure, and can be significant in specific ocean areas. Because platform topside geometries were traditionally considered too complex to mesh in high detail, CFD simulations relied on simplified, de-featured models. Their low fidelity meant that, when CFD was used, the results needed to be validated and refined through expensive, labor-intensive fabrication and testing of physical models in wind tunnels.
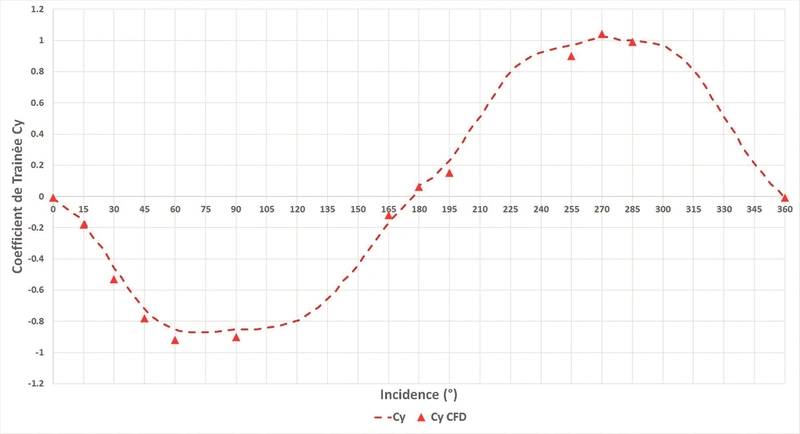
But in a recent R&D project funded primarily by French multinational oil and gas company Total S.A., with engineering management and additional funding from offshore engineering firm DORIS Engineering, numerical aero and hydrodynamics specialist HydrOcean, subsidiary of Bureau Veritas Marine & Offshore, succeeded in meshing a fully detailed CAD model of a topsides module. Using this high-fidelity CFD model, HydrOcean investigated the effects of multiple wind angles on the platform, matching experimental data from wind tunnel and wave basin tests with wind generation capabilities to within 10 percent - and in most cases 3 to 5 percent - at a fraction of the cost.
The project was financed through Collaborative & Innovative Technology Program in Exploration and Production of Hydrocarbons (CITEPH), a French national program that facilitates access to private funding of innovative R&D projects in oil and gas and related energy industries (http://www.citeph.fr/en/). This was the second of two CITEPH projects in which HydrOcean received funding from Total to develop and validate the use of numerical CFD technology, specifically STAR-CCM+, to compute wind loads on offshore platforms.
CITEPH Wind Loads I
In the CITEPH Wind Loads I project, completed in 2013 and funded entirely by Total, HydrOcean used CFD to reproduce results of wind tunnel experiments that had been performed for a large FPSO unit in West Africa. The project successfully validated the use of CFD for such applications, and enabled to identify the bias of experiments such as confinement, scale effects and boundary layer effects.
CITEPH Wind Loads II
With the use of CFD validated, the CITEPH Wind Loads II project was designed to push CFD to its limits. This project, again managed by HydrOcean, required finding ways to increase the fidelity of both the physical models used in wind tunnel and wave basin testing and the numerical CFD model.
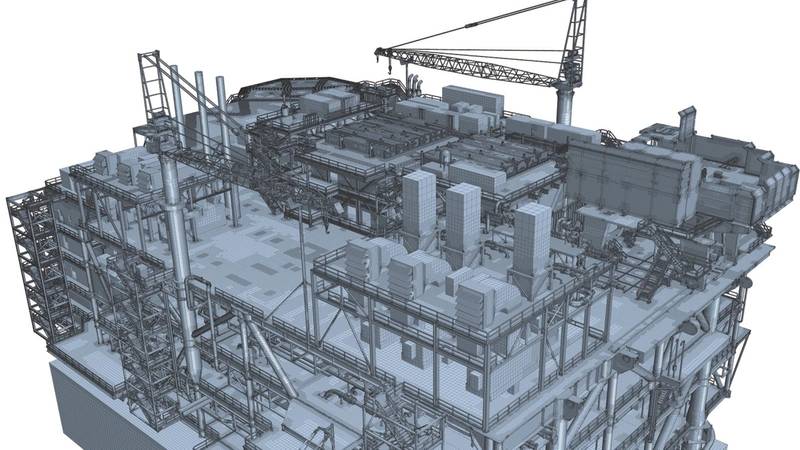
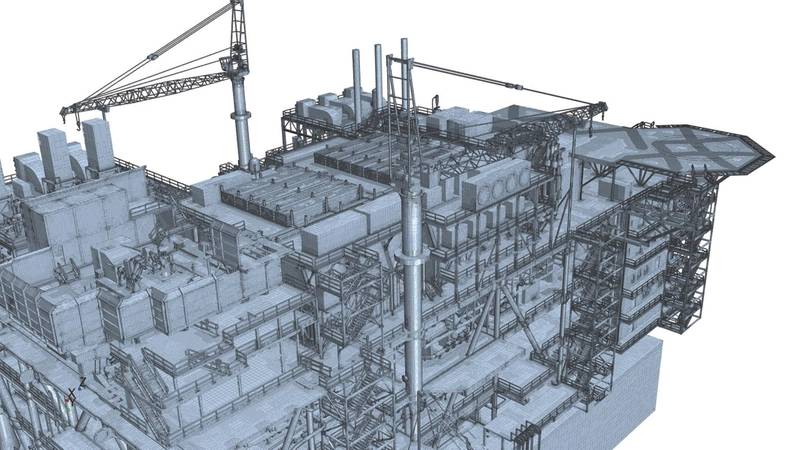
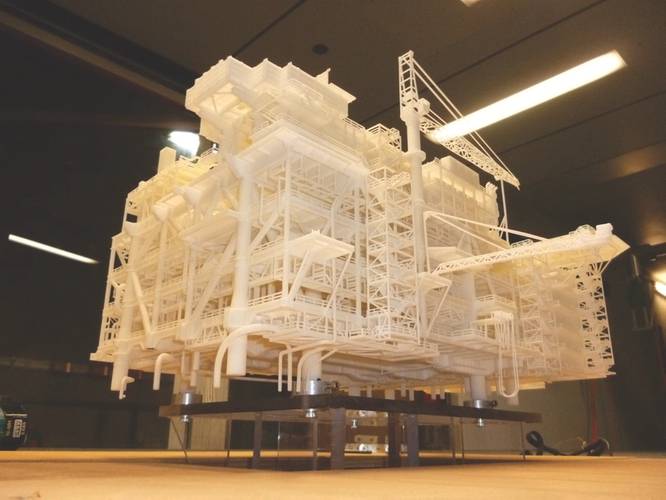
Traditionally, in physical experiments used to assess wind loads over offshore structures, the detailed CAD model of the platform is simplified substantially in the process of creating a physical model for testing. Small pipes are replaced by porosity grids, while complex objects are replaced by boxes, cylinders or other simplified geometry. But in this project, the participants realized that contemporary 3D printing technology would make it feasible to produce physical models that reproduce all the details contained in the CAD model. Meanwhile, for numerical simulation, in theory, any kind of geometry can be captured with today’s CFD meshing tools.
Hence, in this project, there were two parallel workgroups. On the experimental side were CSTB, a provider of research, testing, certification and training for built-environment and construction industries which managed wind tunnel testing for the project, and OCEANIDE, an offshore and coastal engineering firm that took charge of wind load experiments in wave basin testing.
Meanwhile, on the numerical side of the project, HydrOcean’s goal was to take a 3D CAD model of the platform topsides provided by DORIS Engineering designed for other purposes (layout, MTO) and mesh it directly without having to suppress or correct any geometry details. After months of trial and error, HydrOcean succeeded in meshing this extremely complex 3D Rhino model using the surface wrapper in STAR-CCM+, which shrink-wraps a high-quality triangulated surface onto the geometry, closing holes, joining disconnected and overlapping surfaces, as well as automatically discarding obsolete surfaces. The generated grids in this model had on average 140 million trimmed hexahedral cells.
In an intensive joint effort with the Siemens PLM Software support team in France, HydrOcean found the correct parameters that provided good mesh quality (wrapper and volume mesh) and good numerical parameters for the simulation model.
The ultimate goal was to prove the feasibility of bypassing the CAD cleaning phase and use the surface wrapper instead and this was successfully demonstrated.
CFD Results Closely Match Experimental Data
Initially, HydrOcean simulated seven to eight wind heading angles, and the results for the forces were within 3 to 5 percent of experimental test data. Ultimately, the firm simulated 13 headings in all. In the largest divergence from test data, the simulation results differed by 10 percent. Next, two levels of simplification were performed on the CFD model and the corresponding 3D printed model to assess the impact of each simplification on the measured wind loads and moments.
In the first simplification exercise in the 3D printed model, small pipes were replaced with porosity grids and complex objects such as pumps and valves were replaced with boxes, cylinders or other simplified shapes - typical of industry-standard practice at present. In the second, more drastic simplification, the entire platform geometry was replaced by a simple box shape.
The resulting geometries were simulated numerically and also tested physically in the wind tunnel.
Both levels of simplifications compared well for the wind load forces - simulation results differed 5 to 10 percent from experimental results for the first level of simplification, and 8 to 15 percent for the second level. For the moment, however, it was harder to obtain a match, mainly for the most simplified geometry. For the most highly detailed geometry, simulation results were within 4 to 8 percent in average of test results.
No comparisons were made for the first level of simplification. For the second (most extreme) level of simplification, simulation results were within 4 to 6 percent in average of experimental results.
CFD Model Prep
One key interest of project funders Total and DORIS Engineering was to learn whether preparation of CFD models from 3D CAD files could be made as straightforward as the process of converting 3D CAD files into STL files for 3D printing. From extensive prior experience using CAD data to create physical models for wind tunnel testing, the companies knew that this process - although requiring some simplification of the CAD model - is nonetheless much more straightforward than the labor-intensive geometry simplification and de-featuring traditionally required for CFD model preparation. Their goal, says HydrOcean, was to develop a comparable approach for CFD.
The 3D CAD model that HydrOcean received from DORIS Engineering in Rhino format was a clean and for other purposes other than CFD modeling (layout, MTO, etc). However, it presented some features that such as multiple disconnected surfaces and elements, and very high levels of geometric detail which made it difficult to mesh for a CFD analysis.
Initially, the Siemens PLM support team suggested that HydrOcean split the model into multiple boxed regions, perform a local wrapping of each box, then perform a single wrapping operation to merge all the boxes. But HydrOcean decided that approach would require an unrealistic amount of time and labor and would not be the industrially feasible method sought by Total and DORIS.
Instead, HydrOcean decided to invest considerable time and research in finding how to apply the surface wrapper tool to accomplish meshing of the entire geometry in a single process, without splitting the geometry and significant loss of detail. The majority of time was spent on finding how to create a wrapped surface that could generate a very good volume mesh.
The quality of the simulation solution, as confirmed by comparison with experimental data, will be the confirmation that HydrOcean had found a very good wrapping setting and methodology. Initially, the solution did not converge. Upon closer examination, HydrOcean found the simulation model showed some areas of very high pressure, high velocity profiles and other results that revealed some regions of the volume mesh were not of high quality.
Those results, it says, were caused by the wrapper, so it explored how to adjust the wrapping process to create a volume mesh that would yield a simulation that converged. Over some 15 iterations, numerous surface parameters were varied, seeking to find the best connection among elements while avoiding such things as suboptimal triangulation areas in the mesh. In the end, it found surface parameter settings that yielded simulation results that in all instances were within 10 percent of experimental values. Thus, HydrOcean delivered an industrially feasible CFD simulation approach for full-scale, high fidelity, fully featured offshore platform modeling with STAR-CCM+, which will lower prototype and testing costs in the industry.
Key Players
Key individuals leading the project for their respective organizations were Alain Ledoux, naval architect at Total S.A., Olivier Langeard, project engineer at DORIS Engineering, Daniel Barcarolo, PhD, Senior Aero & Hydrodynamic and Project engineer at HydrOcean, Graham Knapp R&D engineer at CSTB, Benjamin Rousse Chief Scientist at Océanide and Olivier Bachman, support and application engineer at Siemens PLM.


