Pangaea Takes Top Spot in Dry Bulk Benchmark Study
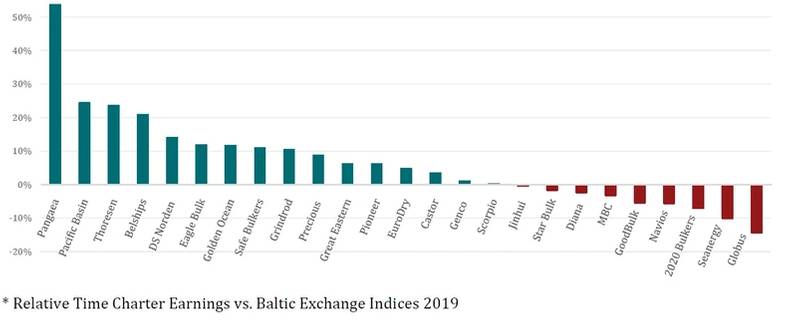
For the second year straight, US-based Pangaea Logistics ranks highest among dry bulk owners based on Time Charter Earnings (TCE), according to a recent market benchmarking report.
Notably, the Rhode Island-headquartered shipowner's 53.7% TCE performance is well above Hong Kong's Pacific Basin Shipping Ltd. (24.3%) and Thailand's Thoresen Thai Agencies (23.5%) in second and third place respectively.
The Vesselindex Performance Report by Danish maritime advisors Liengaard & Roschmann measures the TCE performance of 25 individual companies in relation to the earning potential of their respective fleets, making sure that no company is neither penalized nor getting an advantage from inferior/superior fleet compositions. Hereby the report also, indirectly, measures the effectiveness of the commercial departments on their strategies and ability to utilize the full potential of their asset base.
“Relative TCE performance should be a must-have KPI in every company,” says Søren Roschmann, a Partner at Liengaard & Roschmann. “There is no point in comparing against competitors and industry peers unless you baseline TC earnings against earning potential” he continues.
More than 950 individual vessels, distributed over more than 160 different ship designs, are covered by the report. All these vessels have been allocated an index using the online platform Vesselindex.com, as well as having been individually assessed from a naval architecture point of view with respect to speed/consumption performance.
The authors state that it is the aim of the 100-plus-page report to bring more transparency to TCE thus enabling industry observers, decision makers, investors and others to compare performance across companies on a level playing field. In addition to presenting the overall standings on how the companies have performed against each other, the report also presents the performance in relation to the Baltic Exchange indices.
The study further breaks down performance into segment levels, pointing to larger variations within some companies. As an example, Genco Shipping & Trading managed to rank as top performer in the Supramax segment, whereas they rank last in the Capesize segment. Where the Supramax outperformance could stem from strategical factors such as seasonal positioning, cargo cover or from outstanding shipping craftsmanship, the authors suggest as a general observation that the lesser performance in the Capesize segment could be due to challenges – encountered by many companies during the second half of 2019 – such as scrubber installation and scheduling difficulties due to yard delays, which in turn may have made them unable to take advantage of the strong market rates.
While relative TCE performance can be interesting to look at for a particular year, it really becomes clear who has the right setup and strategy when looking at longer periods of time. Having conducted this study for the first time in 2019 it is still early days, and no clear trends seem to indicate which companies continuously outperform or underperform the market. But time will show.

Pangaea Logistics Solutions Ltd. 53.7%
Pacific Basin Shipping Ltd. 24.3%
Thoresen Thai Agencies Pcl. 23.5%
Belships ASA 20.8%
DS Norden - Ship Owner 14%
Eagle Bulk Shipping Inc. 11.8%
Golden Ocean Group Ltd. 11.6%
Safe Bulkers Inc. 10.9%
Grindrod Ltd. 10.3%
Precious Shipping Pcl. 8.6%
Great Eastern Shipping Company Ltd. 6.2%
Pioneer Marine Inc. 6.1%
EuroDry Ltd. 4.7%
Castor Maritime Inc. 3.4%
Genco Shipping & Trading Ltd. 0.9%
Scorpio Bulkers Inc. 0.1%
Jinhui Shipping & Transportation Ltd. -0.3%
Star Bulk Carriers Corp. -1.7%
Diana Shipping Inc. -2.3%
Malaysian Bulk Carriers Berhad -3.2%
Good Bulk Ltd. -5.5%
Navios Maritime Holdings Inc. -5.7%
2020 Bulkers Ltd. -7.2%
Seanergy Maritime Holdings Corp. -10.1%
Globus Maritime Ltd. -14.4%


