LNG Shipping Costs: A Roller Coaster in Early 2021
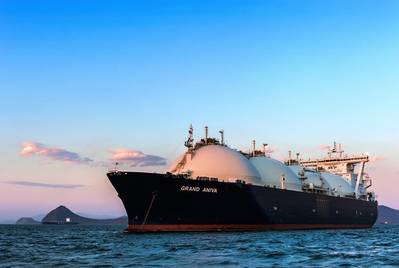
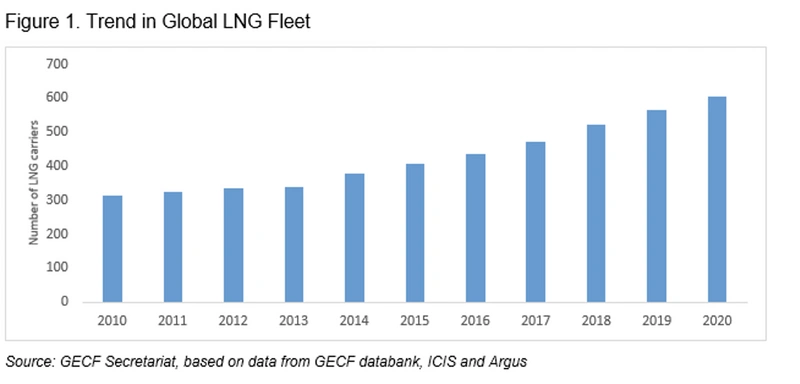
For most of 2020, the liquefied natural gas (LNG) shipping market was in a depressed state like many other segments of the global gas industry. LNG export cargoes fell by 0.2% y-o-y in 2020 to reach 5,682 shipments, driven by a slowdown in LNG demand amid the COVID-19 pandemic. The commissioning of various LNG carriers around the world exacerbated that trend. Between the period 2018 and 2020, the market witnessed the record commissioning of LNG carriers, with 134 LNG carriers coming on line, with 41 of those being commissioned in 2020. As a result, at the beginning of 2021, there were over 600 LNG carriers operating in the global market.
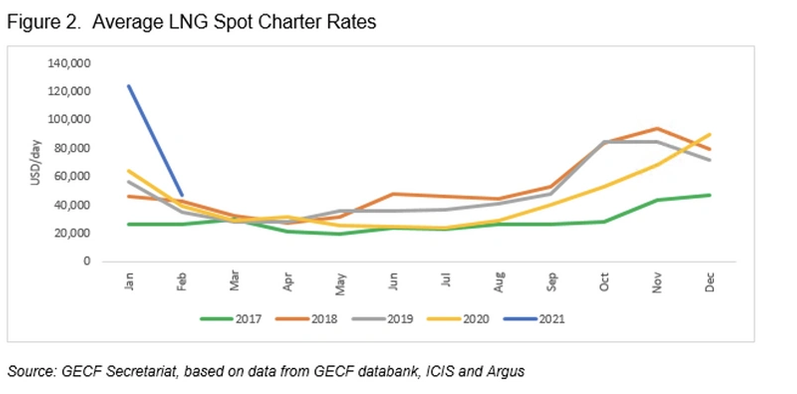
This subdued demand for LNG carriers resulted in the decline in LNG spot charter rates during the first three quarters of 2020, with the average rate for steam turbine LNG carriers reaching $24,000 per day in June and July 2020 -far below the breakeven rate. As a result, LNG shipping costs dropped significantly last year. For instance, LNG shipping costs from the U.S. to Japan fell to $1 mmBtu (from $1.9 mmBtu in January 2020) and from the U.S. to Europe – to $0.5 mmBtu (from $0.9 mmBtu in January 2020).
However, in the fourth quarter of 2020, the LNG shipping market started recovering, driven by the seasonal patterns, mainly the increasing LNG demand and growing usage of LNG carriers for floating storage in anticipation of the winter season. In December 2020, the average spot charter rate for steam turbine LNG carriers reached $90,000 per day, the record high for that month. That helped to improve the situation on the LNG shipping market for the full 2020 year, with the average LNG charter rate declining by 11% y-o-y to $43,000 per day, the lowest level since 2017.
Early 2021 witnessed a strong rebound in the regional LNG markets, with Asian spot LNG prices hitting over $30 mmBtu and European hub-based spot prices reaching almost $10 mmBtu, which was impressive compared to the $2 mmBtu experienced in summer of 2020. Such a dramatic jump in prices was mainly driven by an uptick in LNG demand, amid a colder-than-usual winter season in Asia and Europe, as well as the stagnation of global LNG supply, which was at the same level as in January 2020. Skyrocketing LNG charter rates, driven by a shortage of LNG shipping capacity as well as delays at the Panama Canal, also contributed to a surge in LNG prices, with charter rates reaching the record highs of $124,000 per day for the month of January. The previous record was set in January 2013, with charter rates touching $119,000 a day.
Surging LNG charter rates, coupled with rising shipping fuels prices, resulted in a sharp increase in LNG shipping costs in January 2021, with the cost of transportation from the U.S. to Japan reaching $3.2 mmBtu and from the U.S. to Europe to $1.5 mmBtu.
A shortage of LNG carriers was driven by various factors, including due to a rise in LNG supply from the U.S., which requires more LNG carriers, as LNG deliveries from the U.S. to Asia result in longer trips. In December 2020 and January 2021, U.S. LNG exports tripled compared to July 2020 to reach a record 6 million tonnes (mt).
Rising supply from the U.S. put high pressure on LNG shipping through the Panama Canal, which is critical for LNG transportation to Asia. In January 2021, LNG carrier transit in the waterway reached a record 58 passages, including both laden and ballast voyages. That resulted in delays of the passage of LNG carriers there and reduced the amount of carriers available for spot chartering. Some carriers had to wait up to 10 days to pass through the Panama Canal. Most of the delays were driven by higher-than-expected LNG traffic, weather disruptions and a large number of vessels passage through the waterway at that time. The congestion at the Panama Canal forced various LNG suppliers to refrain from passing through the waterway in favor of bypassing the Cape of Good Hope or sailing via the Suez Canal, which takes far longer and results in higher LNG shipping costs.
After the Canal’s authorities took measures to ease the congestion at the waterway, delays in the passage reduced. That, coupled with a slowdown in LNG demand, resulted in a decrease in LNG shipping costs, with the average spot charter rate for steam turbine LNG carriers falling to $47,000 per day in February 2021. Moreover, a slowdown in LNG demand, coupled with a rise in shipping availability, resulted in charter rates falling to $16,000 per day in mid-March 2021.
Nevertheless, a shortage of LNG carriers and the congestion at the Panama Canal may recur in the next winter seasons, especially taking into account the rising U.S. supply to Asia, which may raise charter rates and LNG shipping costs.
Because of a drop in gas inventories in Europe and Asia during the current winter season, driven by colder-than-usual weather, these two major gas importing regions will have a higher-than-usual demand for gas imports in the upcoming summer season to replenish underground storage in case of Europe and LNG storage in the case of Asia. In this context, we may anticipate the growing supply of LNG in the short term. It will be quite competitive to pipeline gas supply, taking into account that the costs of LNG transportation have been coming back down to baseline, with spot charter rates expected to stabilize in the range of $30,000-40,000 per day in summer. Given the competitive advantages of GECF Member Countries in LNG supply, including their low-cost of production and geographical proximity to major LNG importing regions, we may expect them to fill the supply-demand gap.


