Wave goodbye to $50 bln - Drewry
Container industry revenues are contracting faster than carriers can cut costs. First-half results so far suggest sales are down by around 18%, increasing the pressure to reduce costs.
The container shipping industry is currently enduring a severe revenue contraction that is placing carriers under enormous pressure to squeeze more savings wherever they can and is driving the latest round of M&A activity.
The first-half 2016 financial results that have been published so far from a handful of major carriers paint a very depressing picture for the industry. First-half revenue from the sample companies listed in Table 1 was down by 18% on average, which if it holds true for the industry across the full year would mean that carrier income will shrink by approximately $29 billion against 2015. That would see industry revenue fall below the level seen during the industry’s nadir of 2009.
The difference between 2009 and now is that back then the industry’s cost base was far higher, leading to a collective operating loss in the region of $19 billion. Shipping lines are now more cost-effective, but even so the industry will probably lose at least $5 billion this year, according to proprietary forecasts from Drewry’s Container Forecaster.
With carriers waving goodbye to likely more than $50 billion of sales in two years since 2014 – in 2009 the sales reduction was about $66b in just one year – it should be no surprise that most of the big players are losing money and that some are close to the financial abyss, or that a number of lines are merging in order to better prepare for such hard times.
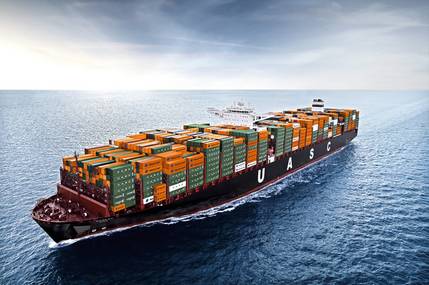
After years of M&A inactivity, the container market has seen a flurry of M&A deals recently, involving the Chinese state carriers Cosco and China Shipping, French carrier CMA CGM buying NOL/APL, and Germany’s Hapag-Lloyd merging with Arab line UASC. On top of all that, carriers have developed bigger alliances to pool their resources and try and find more cost savings. All of these moves are defensive strategies forced upon carriers by the weak state of the market.
Table 1
Selected carrier 1H16 results
Notes:
n.a = not available; n.m = not meaningful;
[1] Local currency numbers were converted into US dollars using the average exchange rate for the period.
[2] EBIT for K Line, MOL and NYK is “ordinary income” = income other than capital gain.
[3] Results for K Line, MOL and NYK relate to their 4QFY15 and 1QFY16 fiscal periods from January through June.
Source: Drewry Maritime Research (www.drewry.co.uk)
The latest results indicate that the second quarter was harder on carriers than we expected with operating margins falling to the lowest point since the first-quarter 2012 (see Figure 2). While they were still generally negative, results for the first-quarter 2016 did at least suggest that the quarter-on-quarter deterioration had been arrested, giving hope that better times might be here soon. However, that now seems like a blip and even our expectation for a stronger second-half of the year is looking less firm than before with a muted rate recovery and rising fuel costs. Adding to carriers’ woes, the third-quarter peak season will probably be a washout too.
Figure 2
Estimated carrier industry EBIT margins, 1Q14-2Q16
Notes: Based on average of sample carriers after currency conversion to US dollars when neccesarry.
Sample consists of APL; CMA CGM; Evergreen Marine Corp; Hanjin Shipping (container); Hapag-Lloyd, HMM (container); K Line (containerships); Maersk Line; Matson (ocean transportation); MOL (containerships); NYK (liner); Regional Container Lines; Samudera Container Lines; Wan Hai; Yang Ming and Zim.
*2Q16 is a preliminary result based on fewer carriers.
Source: Drewry Maritime Research (www.drewry.co.uk)
Figure 3
Trends in container spot rates, bunker prices, monthly averages
Source: Drewry Container Freight Rate Insight (www.drewry.co.uk/cfri); Drewry Maritime Research (www.drewry.co.uk)
Carriers are starting to get some traction on spot market freight rates but not at the anticipated speed (not forgetting that longer contract terms have already been fixed at low levels) and with bunkers becoming more expensive unit costs are now in excess of unit revenues. The distance between the two will very likely have expanded sharply in the second-quarter 2016 when all of the data becomes available (see Figure 4), hence the bigger losses. Having been on a strict cost-saving diet for a number of years already, some carriers might not be able to find any more fat to trim. One obvious option is to look for M&A synergies – Hapag-Lloyd anticipates $400 million pa from the merger with UASC – but such savings are not guaranteed nor will they happen overnight.
Figure 4
Estimated industry freight rates, unit costs (USD)* Preliminary forecast based on smaller sample data
Source: Drewry Maritime Research (www.drewry.co.uk)
Drewry View
In the current declining revenue era for box carriers the pressure to find cost savings is mounting. Prolonged losses will increase the likelihood of more container M&A or more industry consolidation among carriers.


