Container Shipping Outlook Uncertain in 2015: AlixPartners
The outlook for the global container shipping industry remains challenging for the remainder of 2015, according to a new report from AlixPartners.
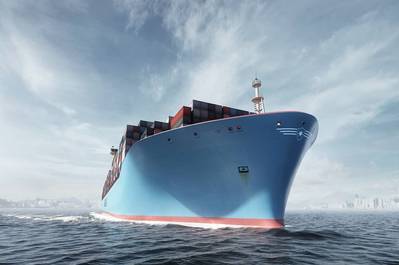
In its annual outlook for the industry, the global business-advisory firm predicts that operating improvements will continue to prove difficult amid flat or declining demand. Many carriers are now looking to balance their books following an influx of "megavessels."
The AlixPartners report warns that carriers have been too slow to make any changes to their services or networks in the face of the slump in Brent crude oil prices during 2015 and that recent falls in bunker fuel prices are welcome but will not likely offer a permanent fix. The study notes that demand seems to continue to lag, as evidenced by weekly container pricing remaining relatively flat or down in the past 12 months for several transpacific trade routes, whereas critical Asia-Europe routes are down 15% or more.
To create the report, AlixPartners Global Container Shipping Outlook reviewed the financial results of the world's 15 publicly-traded ocean carriers. Data for 2014 in the study is estimated based on 12-month-prior data through September 30, 2014.
Financial results improve
According to the report, total debt for the world's publicly-traded carriers declined 15% through the end of the third quarter of last year versus 2013, from $107 billion to $91 billion, and capital expenditures for the period declined 14%, from $21 billion to $18 billion. By the same token, the study reveals that industry operating expenses declined by 4%, or $7.6 billion, for the period.
Revenue of the 15 carriers studied decreased 3% in 2014 compared to 2013 and 5% from 2012 and still remains 16% off its 2008 peak of $200 billion. The report notes that despite declining revenues, carriers studied achieved a 7% increase in EBITDA over the same period, with signs of increasing focus on their core container businesses, cutting costs and exiting noncore businesses through asset sales. Only five of the 15 carriers studied demonstrated EBITDA growth from 2012 to 2013 and 2013 to 2014. All of those were Asia based.
Operating expenses decreased by 4%, or $7.6 billion, from 2013 to 2014 and by more than $15 billion since 2012. However, most of these improvements appear due to the disposal of assets (and the associated decreases in depreciation) and not necessarily due to sustained operating improvements.
Underlying performance remains unsustainable
The report notes that Capex investments for larger, long-term projects also declined to $18 billion in 2014, from $21 billion in 2013 and $25 billion in 2012. As a result carriers appear to be focusing on their core business and also improving working capital management.
The Altman Z-score, an indicator of financial distress, was only slightly higher in 2014 than 2013, which was the lowest it has been since the start of the financial crisis. The average score of the carriers was 1.21 for the period studied, suggesting that the industry is possibly a long way from stability as it has remained well within the distress zone (a score below 1.81). While still within the distress zone, it indicates a slightly lower risk of financial risk, and that the market as a whole has slightly bounced back in the past year.
Industry headwinds persist – fuel efficiency driving change
Over the past decade the chase for fuel efficiency has driven the introduction of increasingly large vessels, putting unprecedented pressure on the container shipping segment and this is expected to remain the force driving the industry dynamics in 2015. According to the report, since the end of 2013 the average sized vessel operating in the Asia-North America trade lane increased 9% to 6,566 TEUs (20-foot-equivilent-unit) capacity. At the same time, the average size vessel operating in the Asia-North Europe trade lane increased 4%, to 10,559 TEUs.
Lagging demand driving closer alliances
The number of megavessels (more than 13,300 TEU capacity), which mainly serve the major East-West trade lanes, is forecast to double by the end of 20171. However, lagging demand means that carriers with growing fleets of large vessels are going to have to work more closely together as demonstrated by Germany's Hapag-Lloyd merging with Chilean carrier, CSAV. This concentration of capacity in fewer hands has enabled the ocean carriers to more effectively manipulate vessel sailings, schedules, and transit times. This trend for closer alliances is likely set to continue in 2015.
A bunker boon?
Many of the strategic and tactical decisions taken in recent years have been driven by high oil prices. The slump in Brent crude oil prices to $50 per barrel in the first quarter of 2015 has given many carriers a welcome respite as bunker costs have also declined. However, even a prolonged reduction in bunker prices will likely have a limited impact on container operators' overall performance as shippers will use it as an opportunity to continue calling for a drop in freight rates. Secondly, as the benefits of slow steaming on reducing fuel costs have narrowed, some carriers have raised speeds to increase throughput and revenue; however this will potentially have a negative effect because it serves to further increase capacity in a market that is oversupplied.
A more positive outlook
AlixPartners recommends that carriers looking ahead should focus on the core container shipping business by continuing to pest of noncore assets including terminals and 3PLPs, and focusing on route and customer profitability and driving improvements in working capital.
There also needs to be greater scrutiny by carriers of the profitability of the markets they serve; the routes they sail and the customers they conduct business with. Carriers struggling to find the true profitability of their customers, lanes and services portfolio should consider increasing their investments enterprise-resource-planning (ERP) systems. This is a critical piece of business intelligence that could assist carriers with finding a focus that has been lacking for decades.


