Shipping’s Half Year Report: Extra Classes Needed?
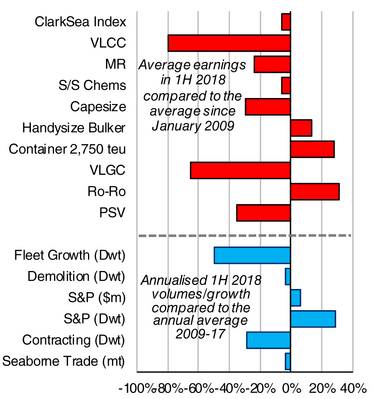
With the industry hoping for better “grades” after the “effort” of recent years, this week’s Analysis updates our half year shipping report showing a ClarkSea Index up 9% y-o-y but still below trend since the financial crisis (see Graph of the Week). After comments of “must do better” and “showing potential” in recent years, do the statistics suggest “extra classes” will again be needed over the summer holidays?
Progress But No Time To Relax!
Our ClarkSea Index (comprising tankers, bulkers, containerships and gas ships) continued to make steady progress, averaging $10,929/day in the first half, up 9% y-o-y but still below trend since the financial crisis. The “subject” breakdown again shows a divergence of performance and, while there is better confidence in parts of the market (see recent Moore Stephens Index), risks and headwinds remain.

Keep Up The Good Work!
A year ago we reported that in bulkers and containerships “fundamentals suggest improvements in the coming years but it may be a bumpy road” and this filtered through with overall bulker earnings up 23% y-o-y and our Handysize Index moving above trend. Disruption to Brazilian iron ore output in Q1 dragged the Capesize index below trend (but still up 16% y-o-y) but there is potential for an improved second-half. The containership market, especially feeders, moved above trend with earnings for a 2,750 teu vessel up 29% y-o-y to move 28% above trend. While the lines have struggled to absorb higher bunker prices and surplus capacity on the mainlanes, values and earnings for charter owners had a positive first half. There was also good progress in the LNG sector, with earnings up 64% y-o-y to move to 16% below trend (last year they were 50% below trend). The Ro-Ro and Ferry market remained firm (Ro-Ros at €17,750/day, 31% above trend), with continued newbuild investment, while the car carrier market remains below trend but may have “turned the corner”. Our overall supply and demand indicators have also generally been helpful with fleet growth limited (1.3% 1H 2018, 50% below trend) and trade on trend (3.2% p.a. compared to 4.1% in 2017 - although keep an eye on tariffs, see SIW 1327). Shipyard output fell further (45.3m dwt, down 25% y-o-y); demolition rose y-o-y helped by a tanker “record”. S&P activity slowed a little from 1H 2017 but remains well above trend, while newbuilding remains below trend (35.1m dwt).
Bringing Down The Averages...
The tanker sector remained firmly in negative territory, with larger ships in particular experiencing their fair share of “pain”. VLCC earnings are the lowest performing against trend although newbuild investment suggests not all investors have “lost faith”. The LPG market remained tough while any regional offshore improvements (e.g. for North Sea PSVs, harsh environment rigs) are from a low base.
Extra Classes?
So some progress, but plenty of scope for improvement. Our last mid-year report suggested “extra classes on regulation and technology” and with the IMO agreement on carbon and a more than doubling of scrubbers ordered in the first half any “revision” would have certainly come in handy! Have a nice summer.

How Are Your Grades Looking?
The red bars show the percentage difference between average earnings in 1H 2018 and since the start of 2009 in each sector. The blue bars show the percentage difference between annualised fleet growth (in percentage terms) or demolition, sales (in value and dwt) and contracting volume in 1H 2018 compared to the annual average in the 2009-17 period. The bar for seaborne trade compares projected growth in million tonnes this year, compared to the annual average growth rate in 2009-17.
The Author
Stephen Gordon, Clarksons Research. Any views or opinions presented here are solely those of the author and do not necessarily represent those of the Clarksons Group.
